Designing And Implementing A VR Data Analysis App
Client
- University of Konstanz (Student Course)
Team
- 2 UX Designers
Year
- 2017 – 2018
Tasks
- Design
- Implementation
What is the best way to visualize and analyze crime data in VR?
CrimeBlocks was a student project I did with two fellow students in a course on data analysis in mixed reality at the University of Konstanz. It is a VR app with which crime data of the city of Chicago can be visualized and analyzed in VR. By showing the number of crimes as three-dimensional, building-like, blocks on a map of Chicago, the app provides an immersive overview of the data in 3D. Simultaneously, a 2D bar chart, which is always in view of the user allows a more fine-grained comparison between selected data. Consequently, the app follows the Information Seeking Mantra, providing an overview first, and then details on demand.
An overview of the features of CrimeBlocks.
Results
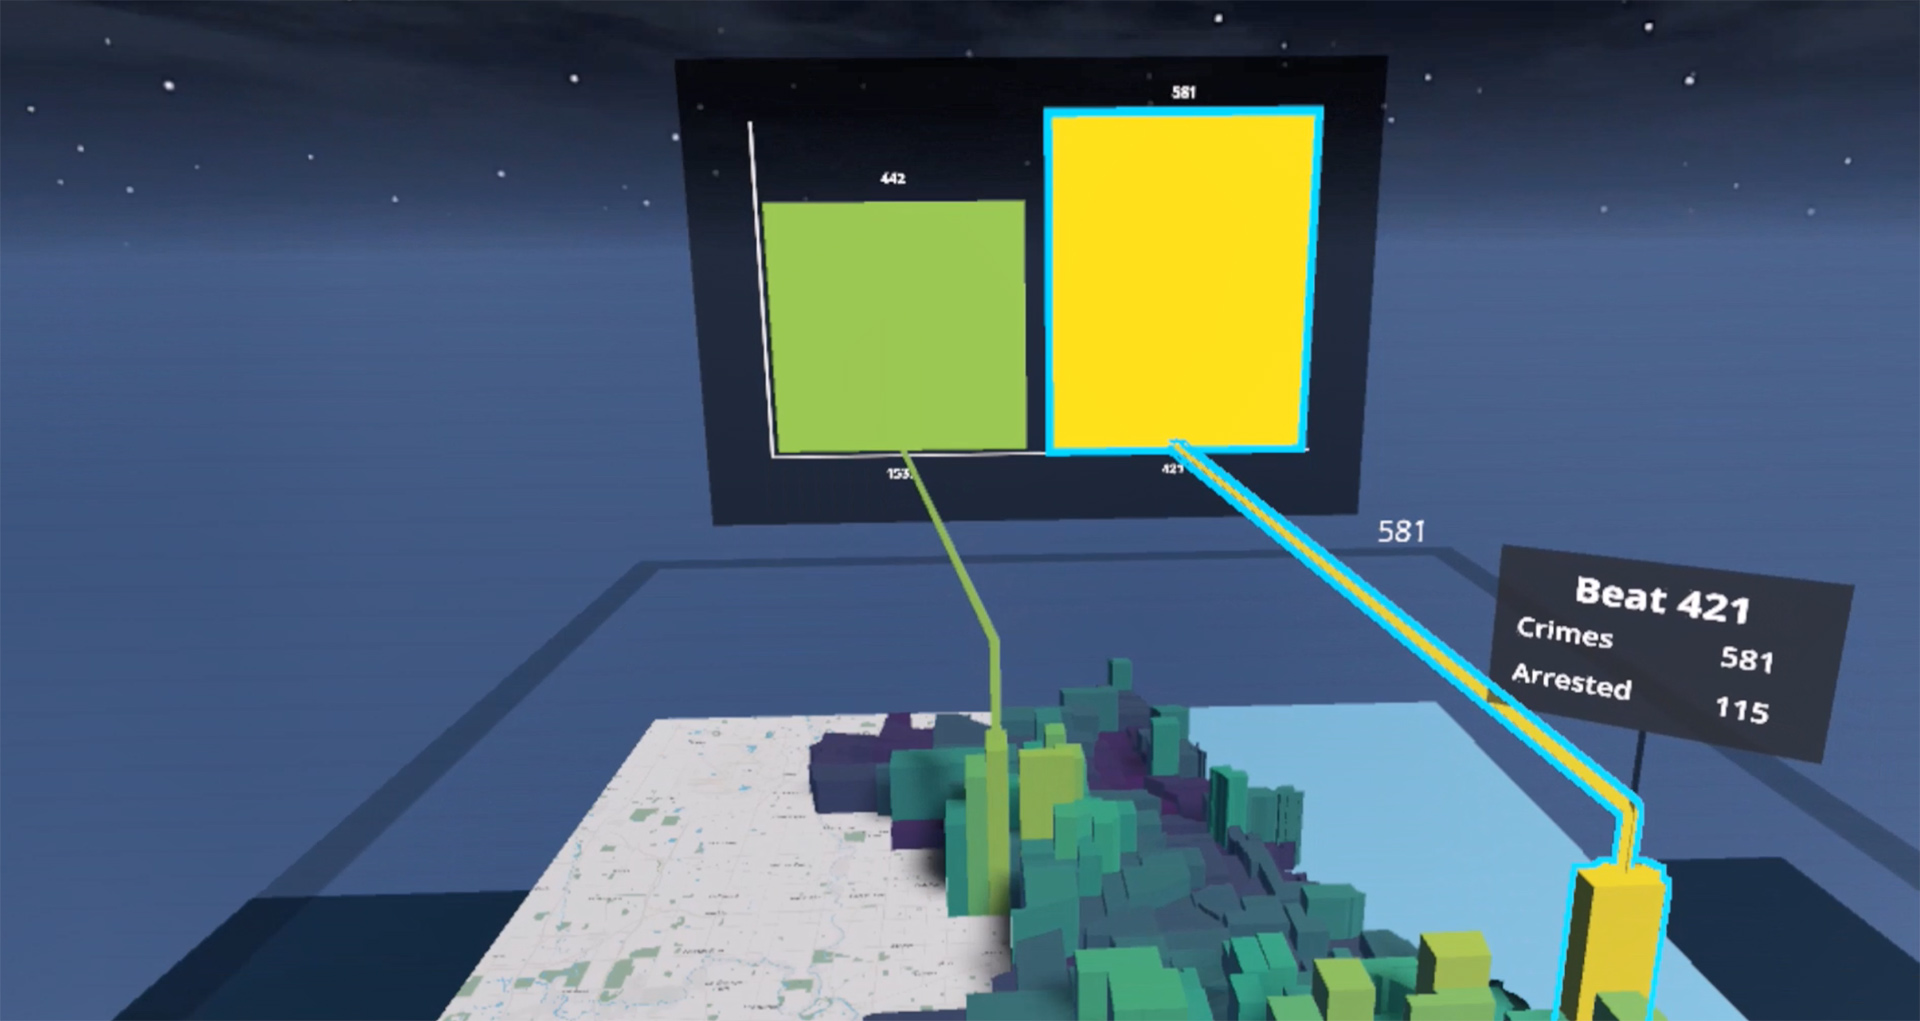
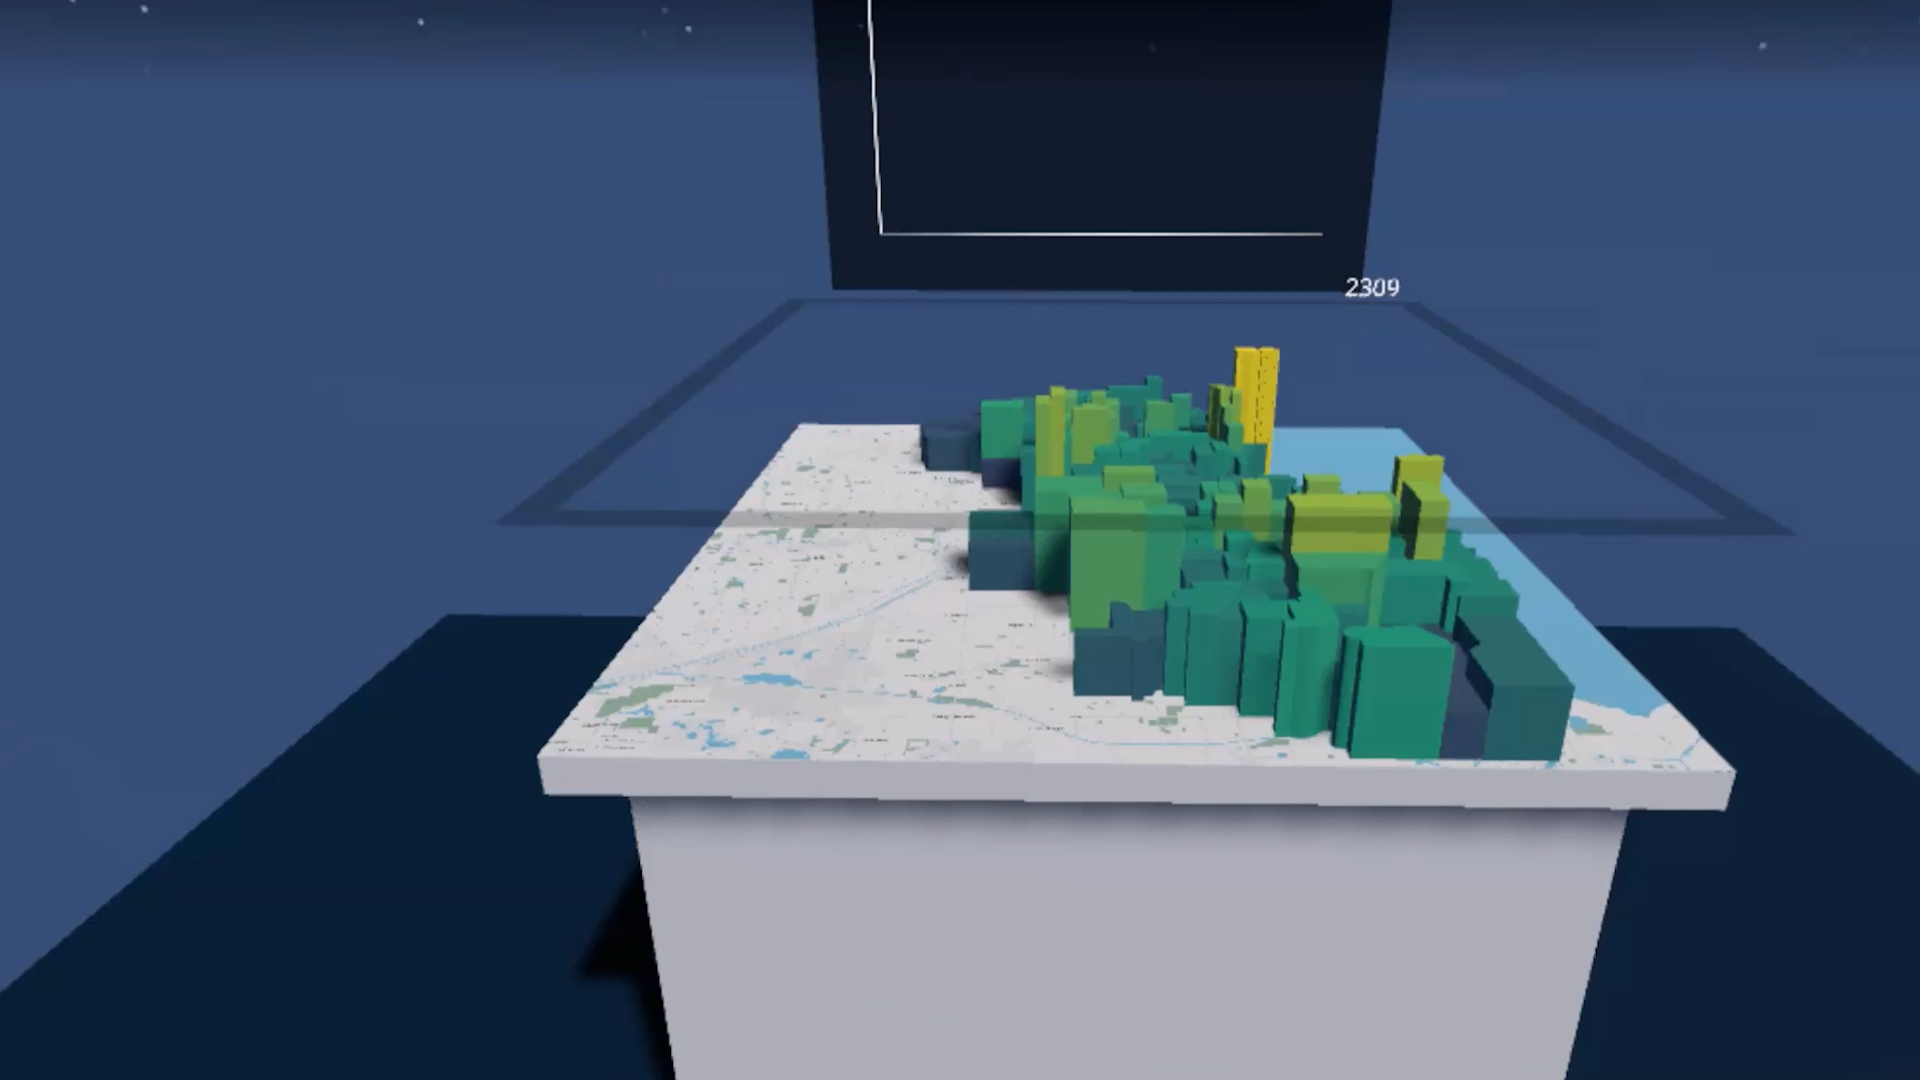
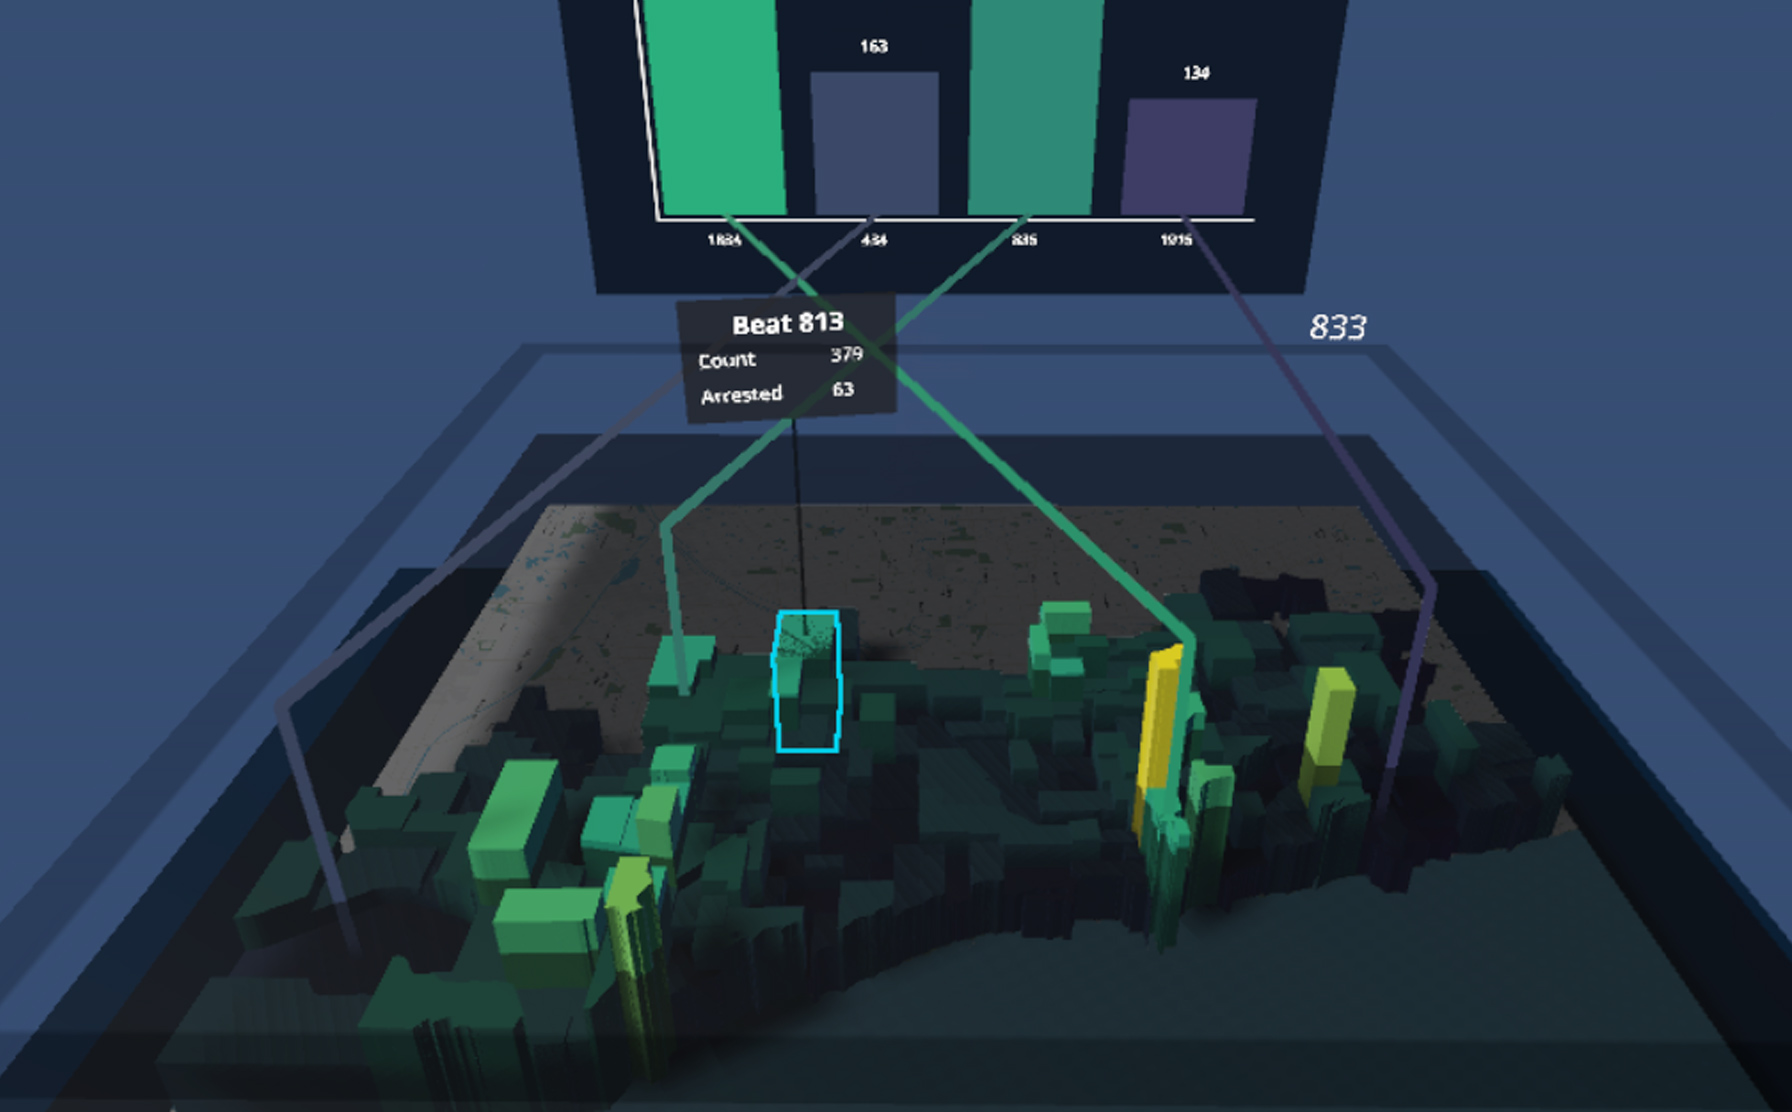
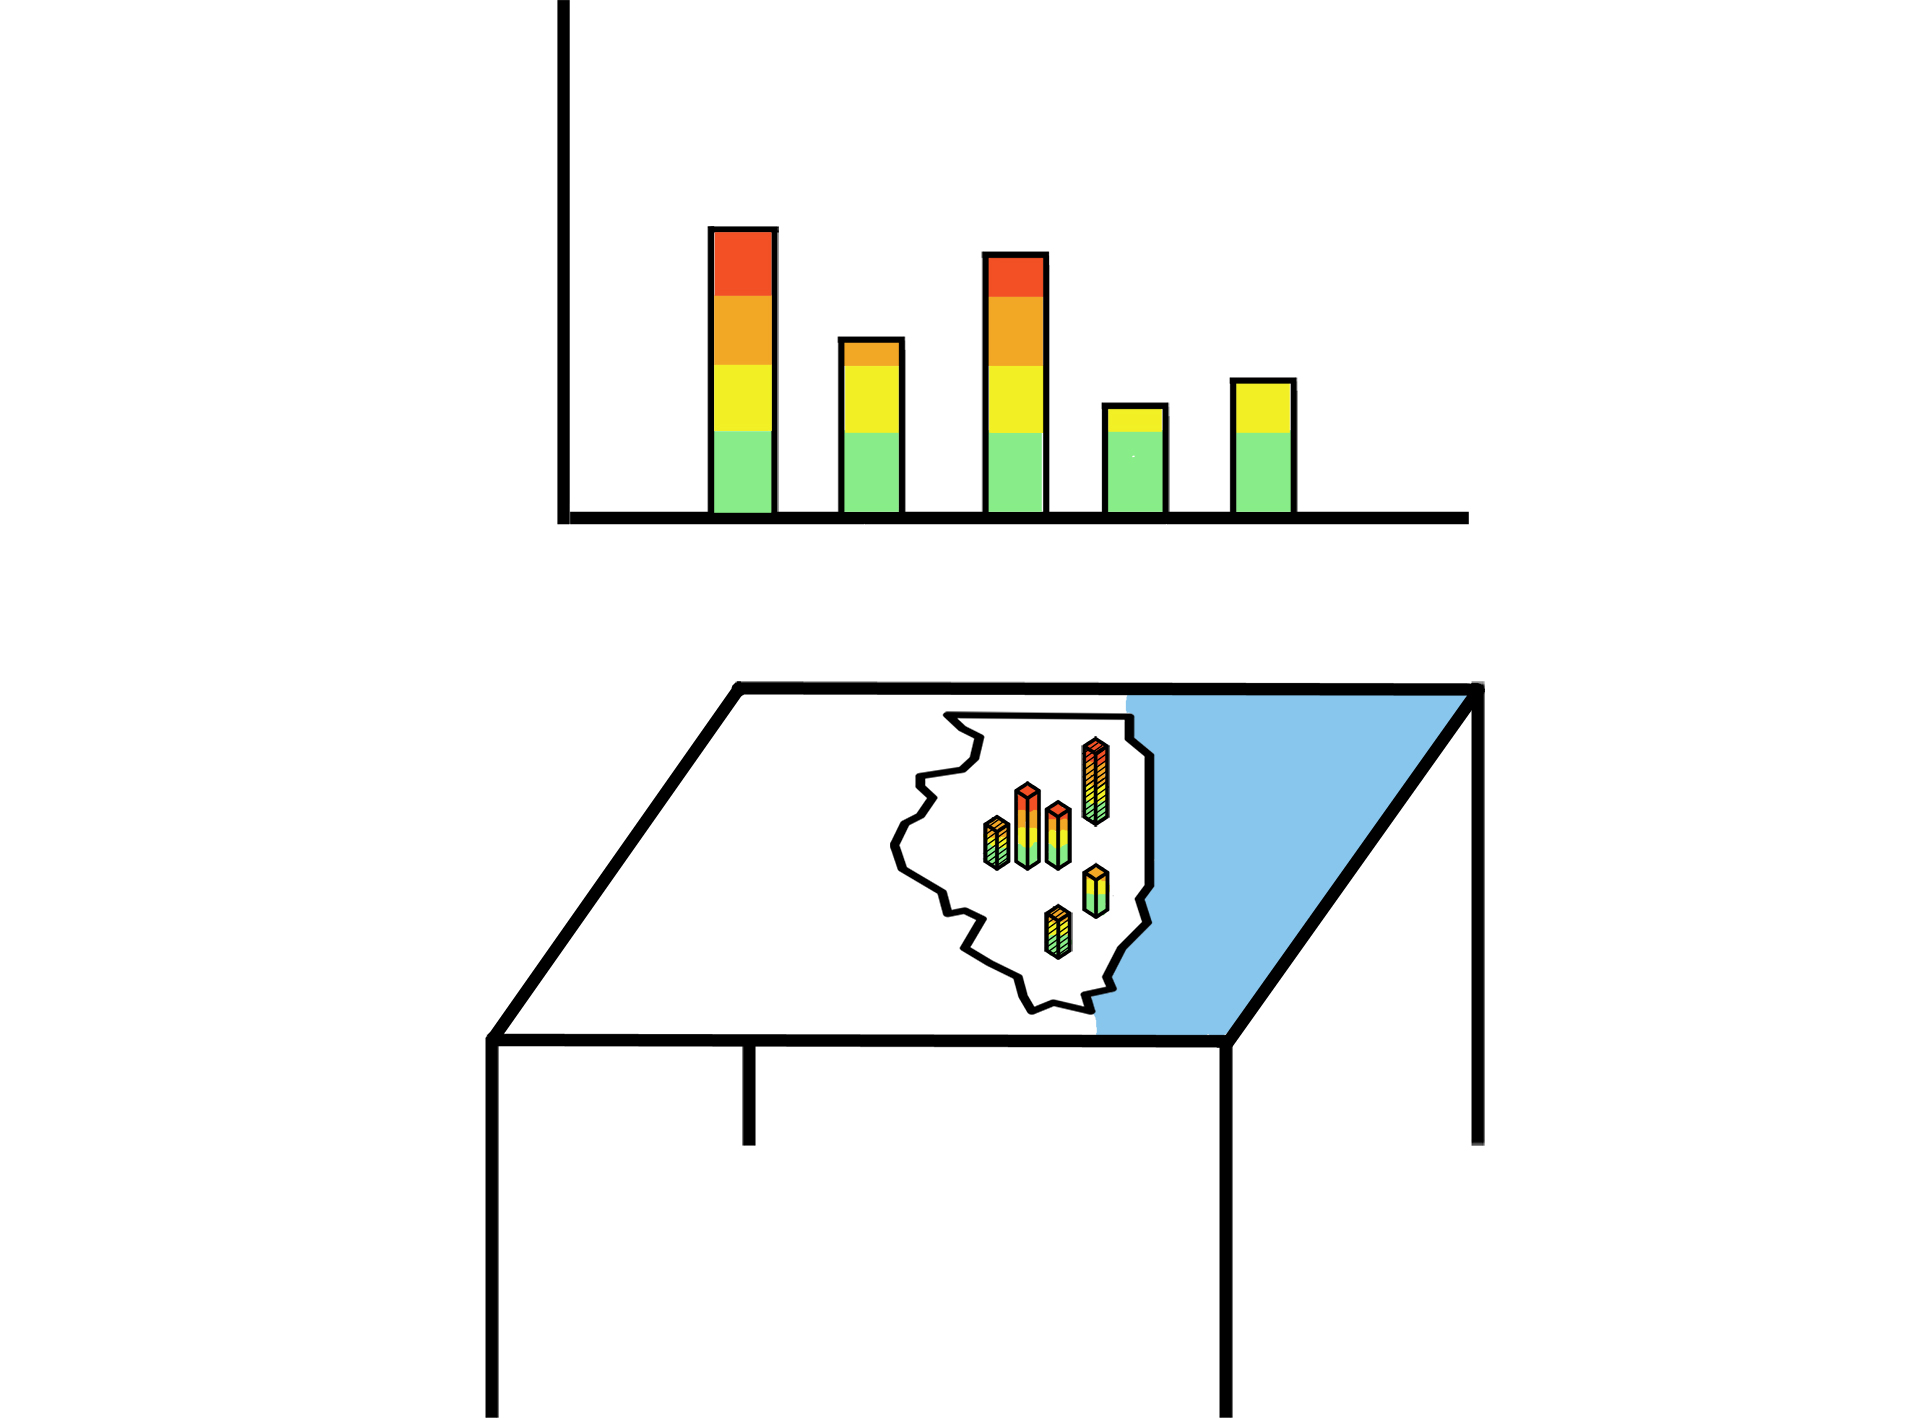
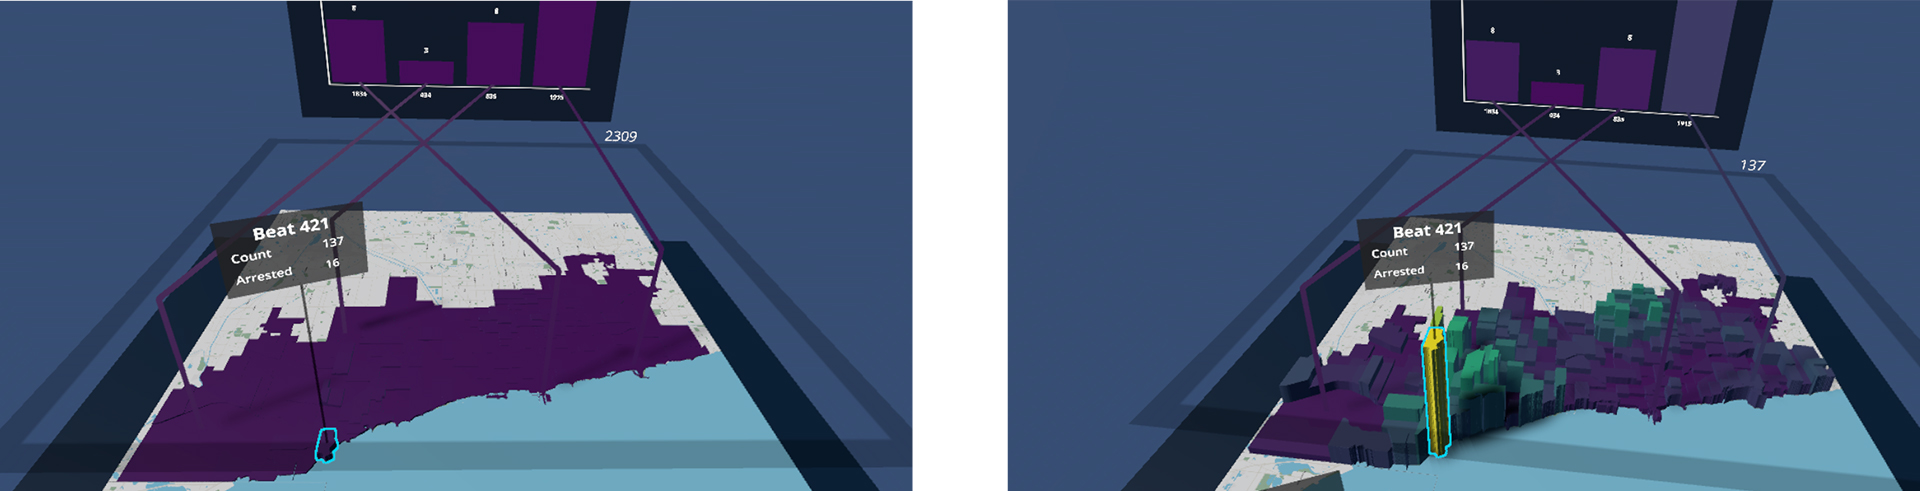
In CrimeBlocks, the user stands in front of a table on which a map of Chicago is printed. On the map, 3D blocks in varying heights and colors are placed, giving the impression of a city skyline. These blocks represent so-called beats, the smallest police districts. The height and color of the beats are determined by the number of crimes in the respective beat. Above the table and always in front of the user hovers a 2D bar chart, which allows for a more fine-grained comparison between selected beats. The connection between 2D and 3D visualization is achieved by a line connecting the 3D beat and its 2D counterpart in the bar chart.
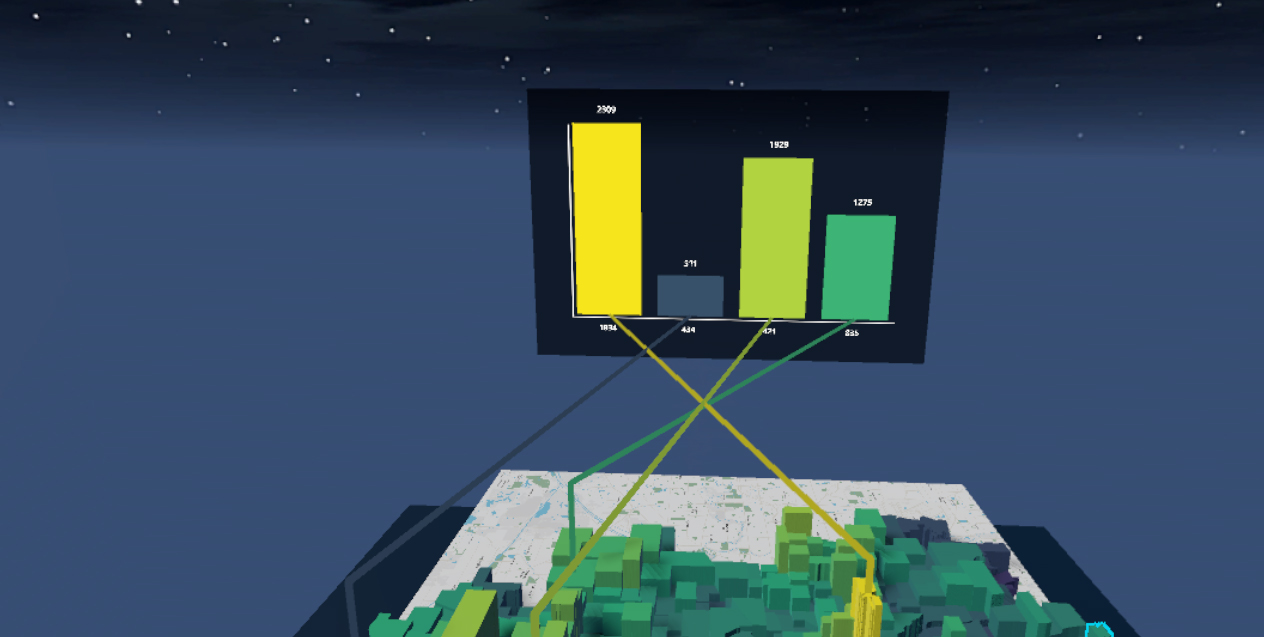
3D and 2D beats are connected via lines.
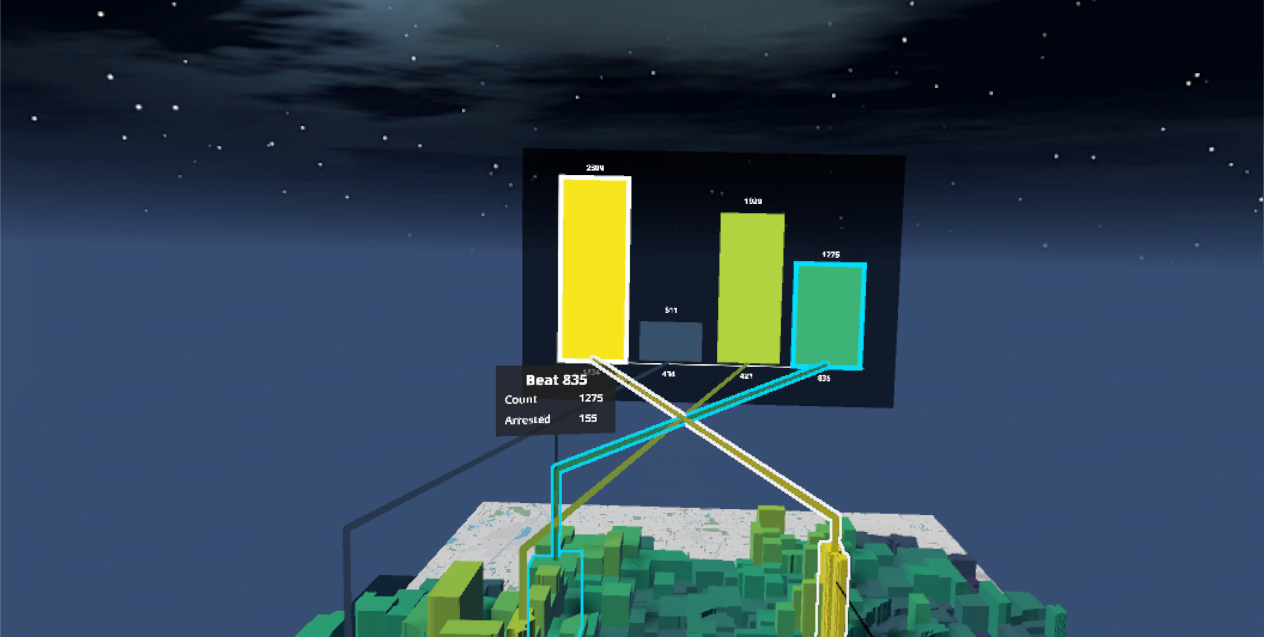
Selected beats are highlighted with an outline glow.
Multiple features, all available from a 2D UI attached to the user’s controller, allow activating or deactivating specific features or manipulating the data in real-time. Regarding the latter, the user can filter between crime types, locations, and times of the crime. Regarding the former, the app can, for example, render a line around the table which shows the maximum value of all shown beats or a slightly opaque plane that that hides all beats below the currently selected one. Further features include only rendering the selected beats or normalizing the data.
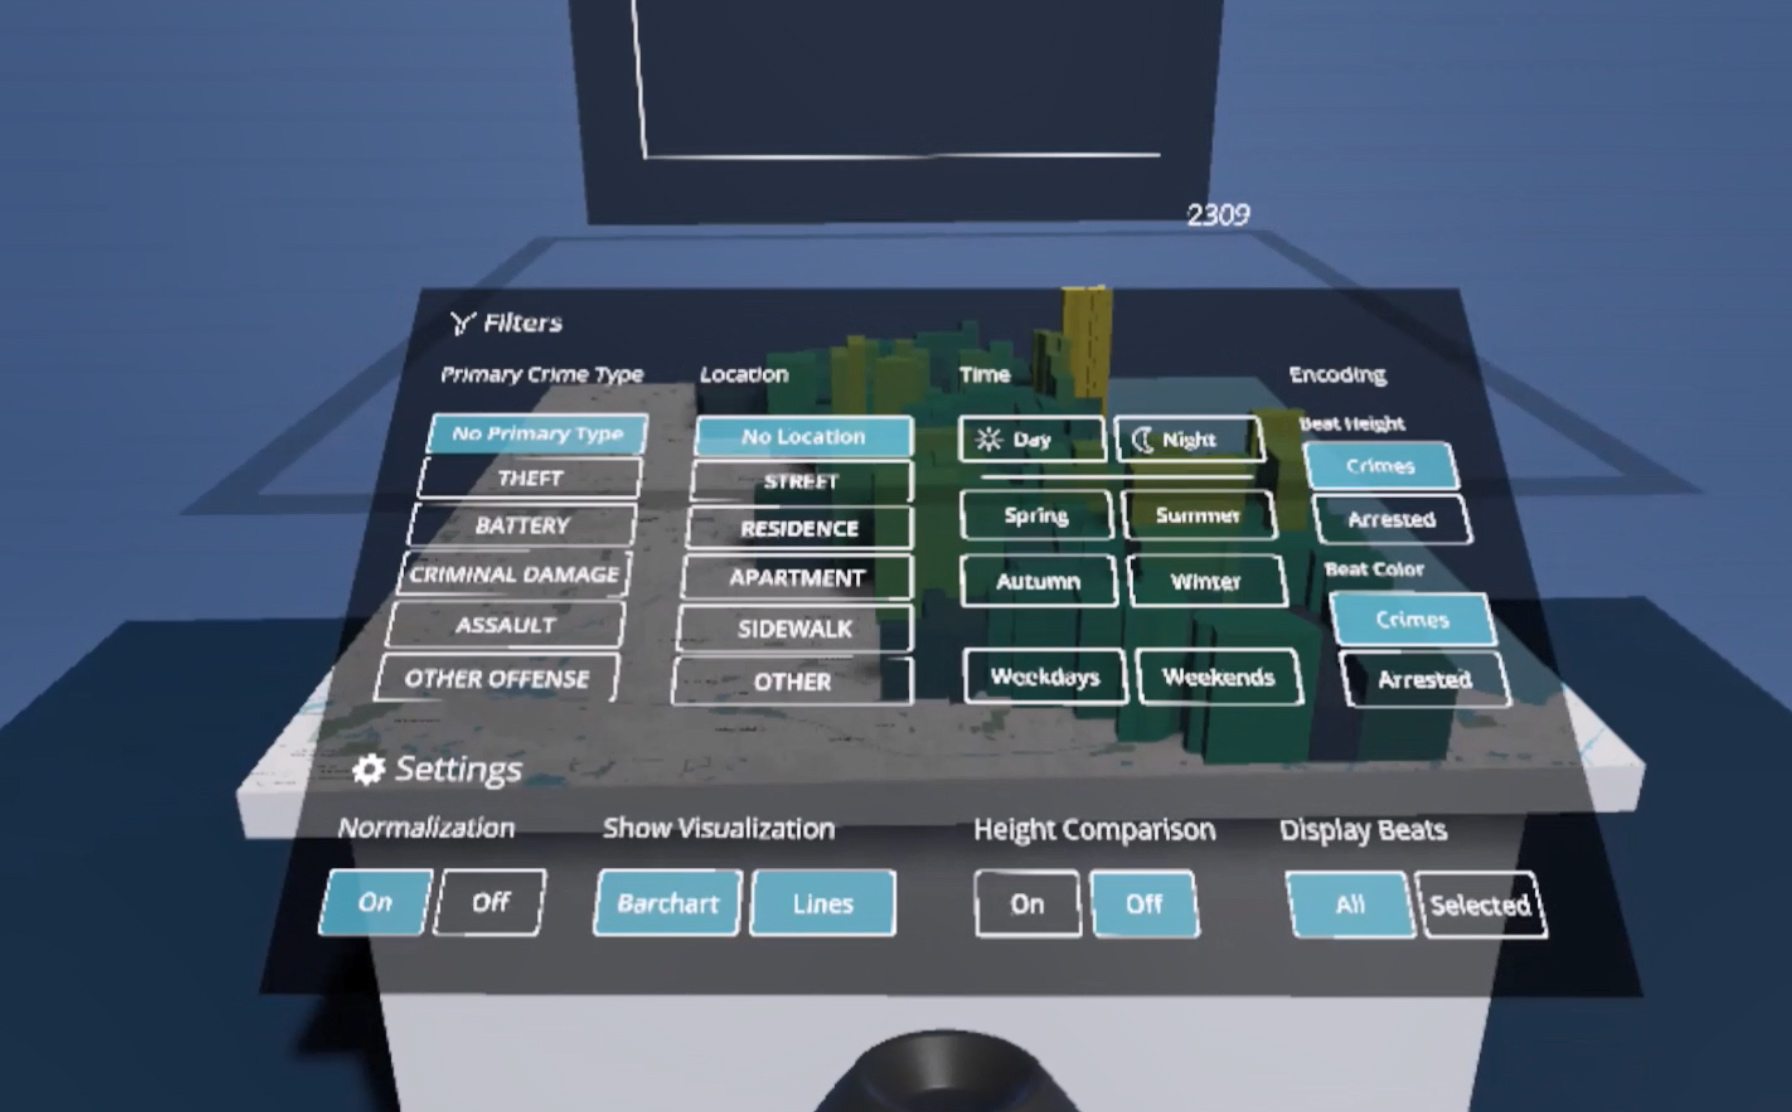
The UI of CrimeBlocks is divided into a filters and settings section.
The opaque plane hides all beats below the height of the selected beat. The border around the table shows the maximum value of all beats shown.
Process
We developed CrimeBlocks in three steps, starting with analyzing the data to find possible visualization methods and possible difficulties. Then, we sketched ideas and created storyboards for the interaction before we started developing.
Analyzing the data
To familiarize ourselves with the data, we first visualized it using the map functions of various standard data analysis tools such as Tableau or Excel. Especially because of the representation in Excel’s 3D map, it became clear that assigning the criminal offenses to individual blocks of houses was too detailed and confusing. Simultaneously, an analysis of the data in Tableau showed that this exact geographic assignment gave the impression that all crimes take place on the street.
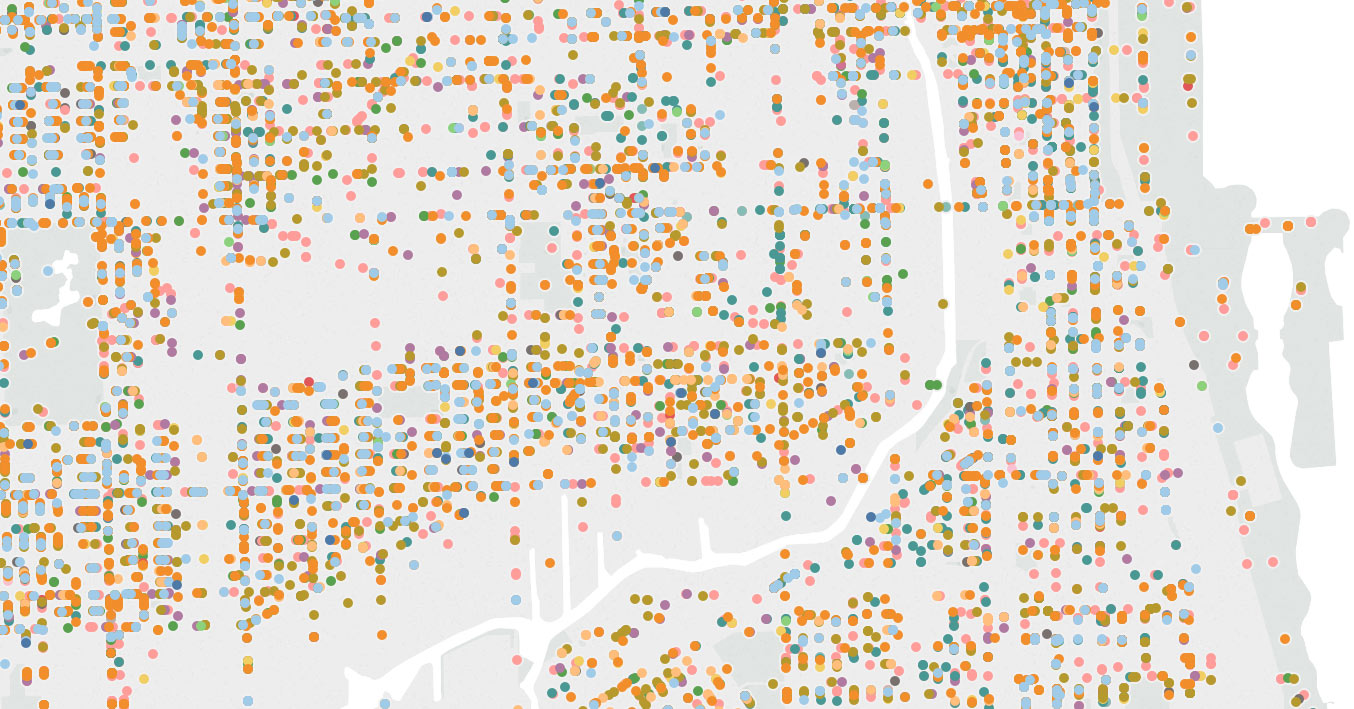
Tableau's representation of the data.
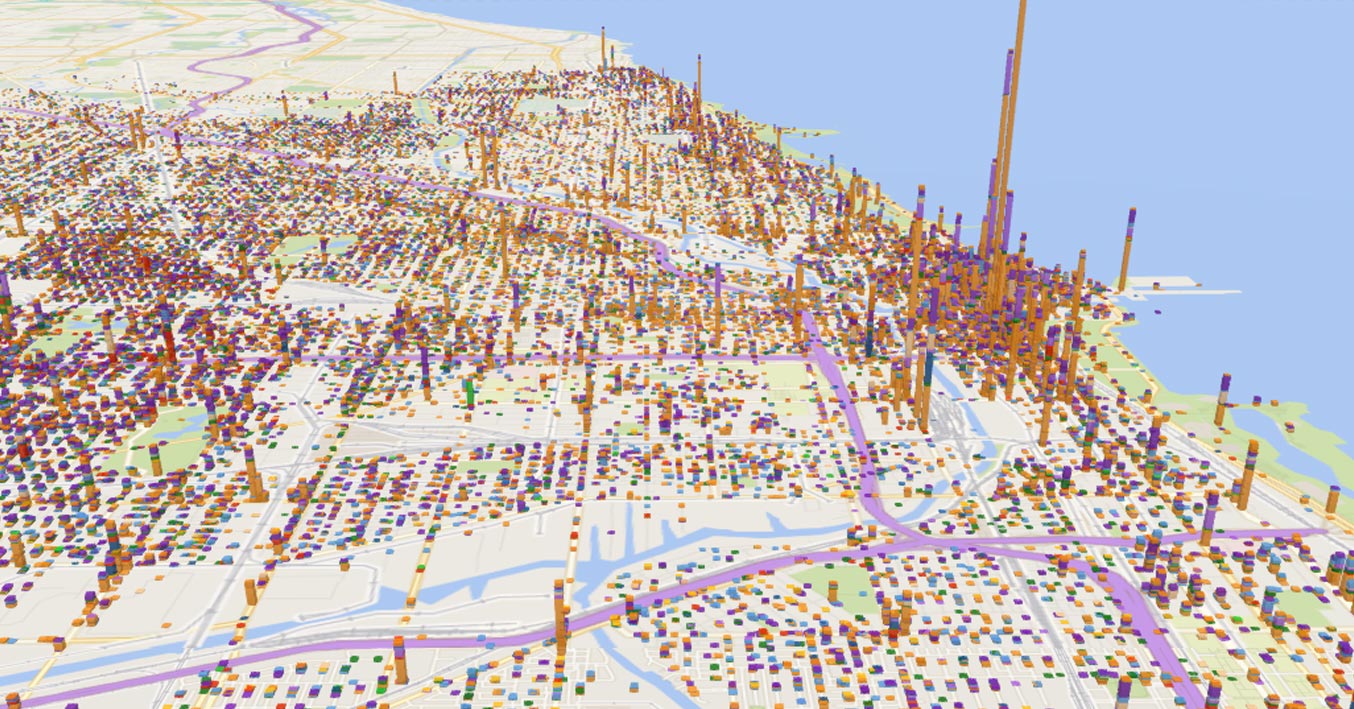
Excel's representation of the data.
We, therefore, decided to assign the crimes to the smallest police areas contained in the data set, so-called Beats. Consequently, by first looking at how standard tools would visualize the data, we gained two advantages: We could find out possible ways of improvement and we could use the visualizations to check whether we implemented the representation and distribution of the data correctly in our first implementation steps of the VR environment.
Sketching Ideas
Then, we sketched initial ideas for the interaction with the data. While it was clear to us how we wanted to visualize the data, we were still unsure of how the user should interact with it. We moved back and forth between mapping most functions to the controller and snapping a larger 2D UI to the wrist of the user. Ultimately, we opted for the latter. Below are some of the scribbles created in that phase. We also created some cleaner illustrations to more clearly communicate these ideas in presentations.
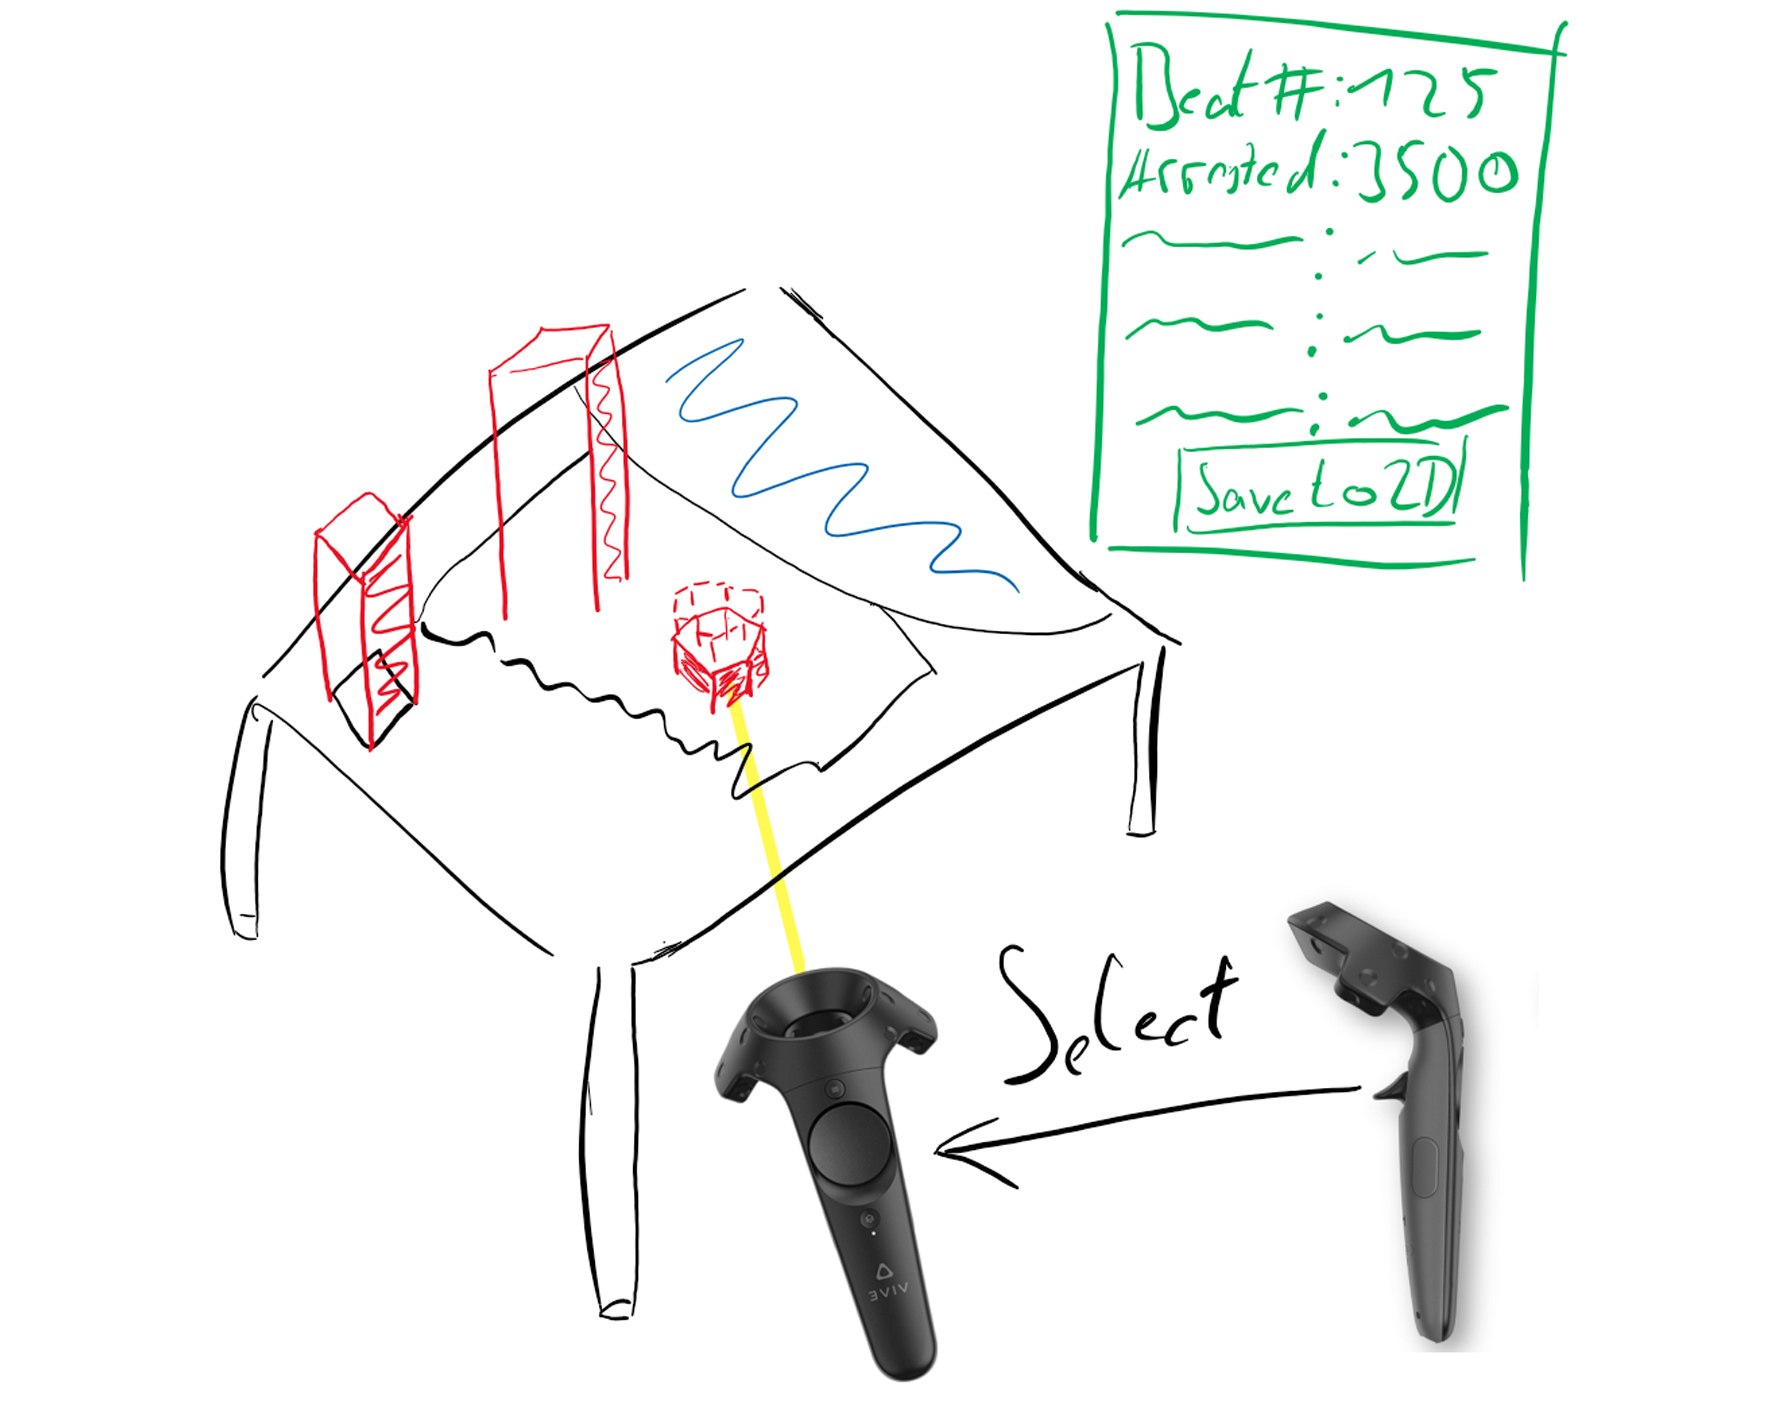
One of the initial scribbes made during ideation.
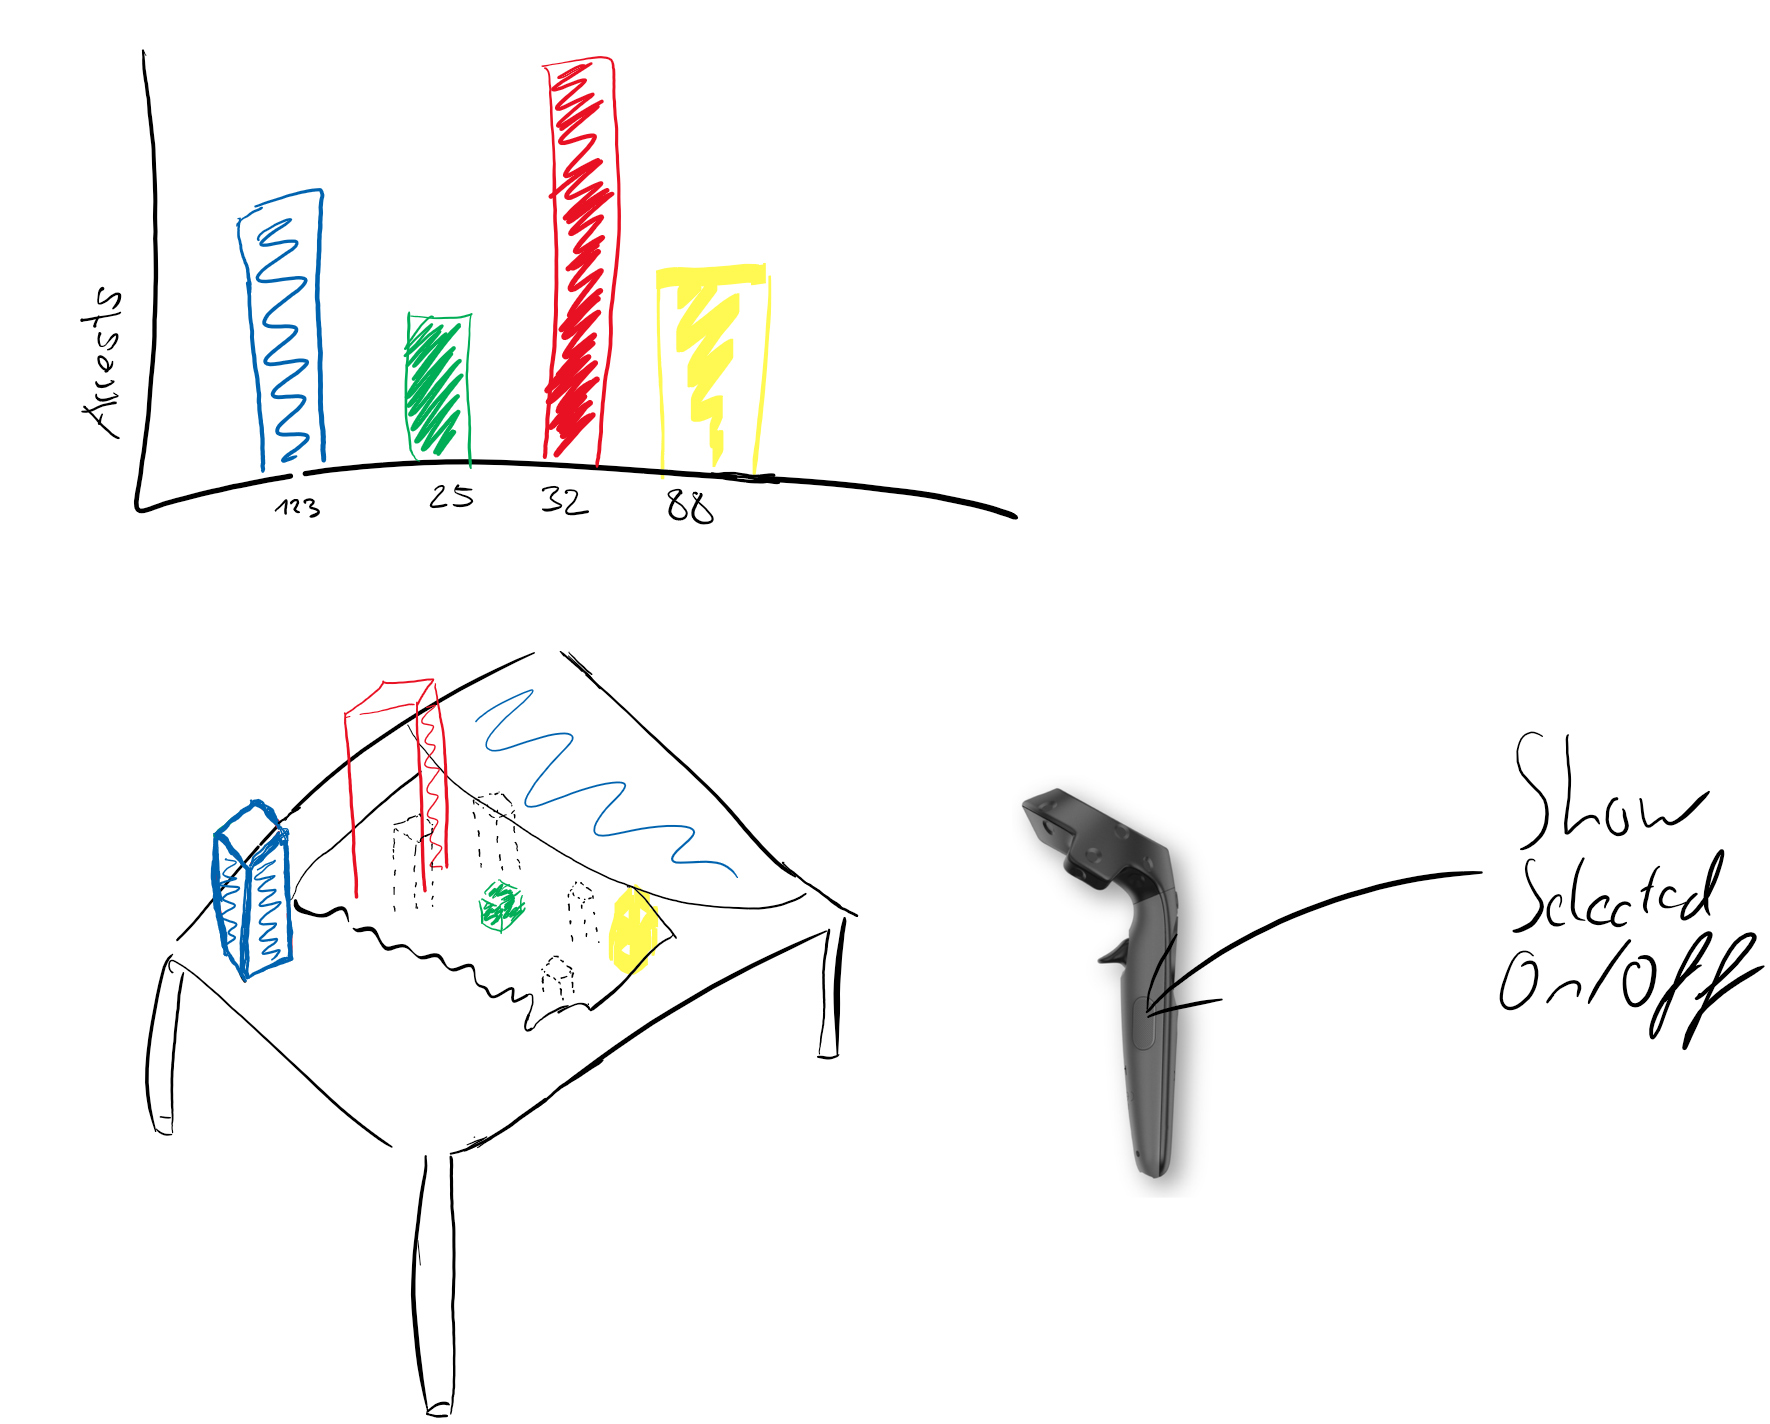
Another idea. At the beginning, we thought about adding the most often used functions to the controller buttons.
For presenting our ideas, we made the sketches a bit cleaner 😉
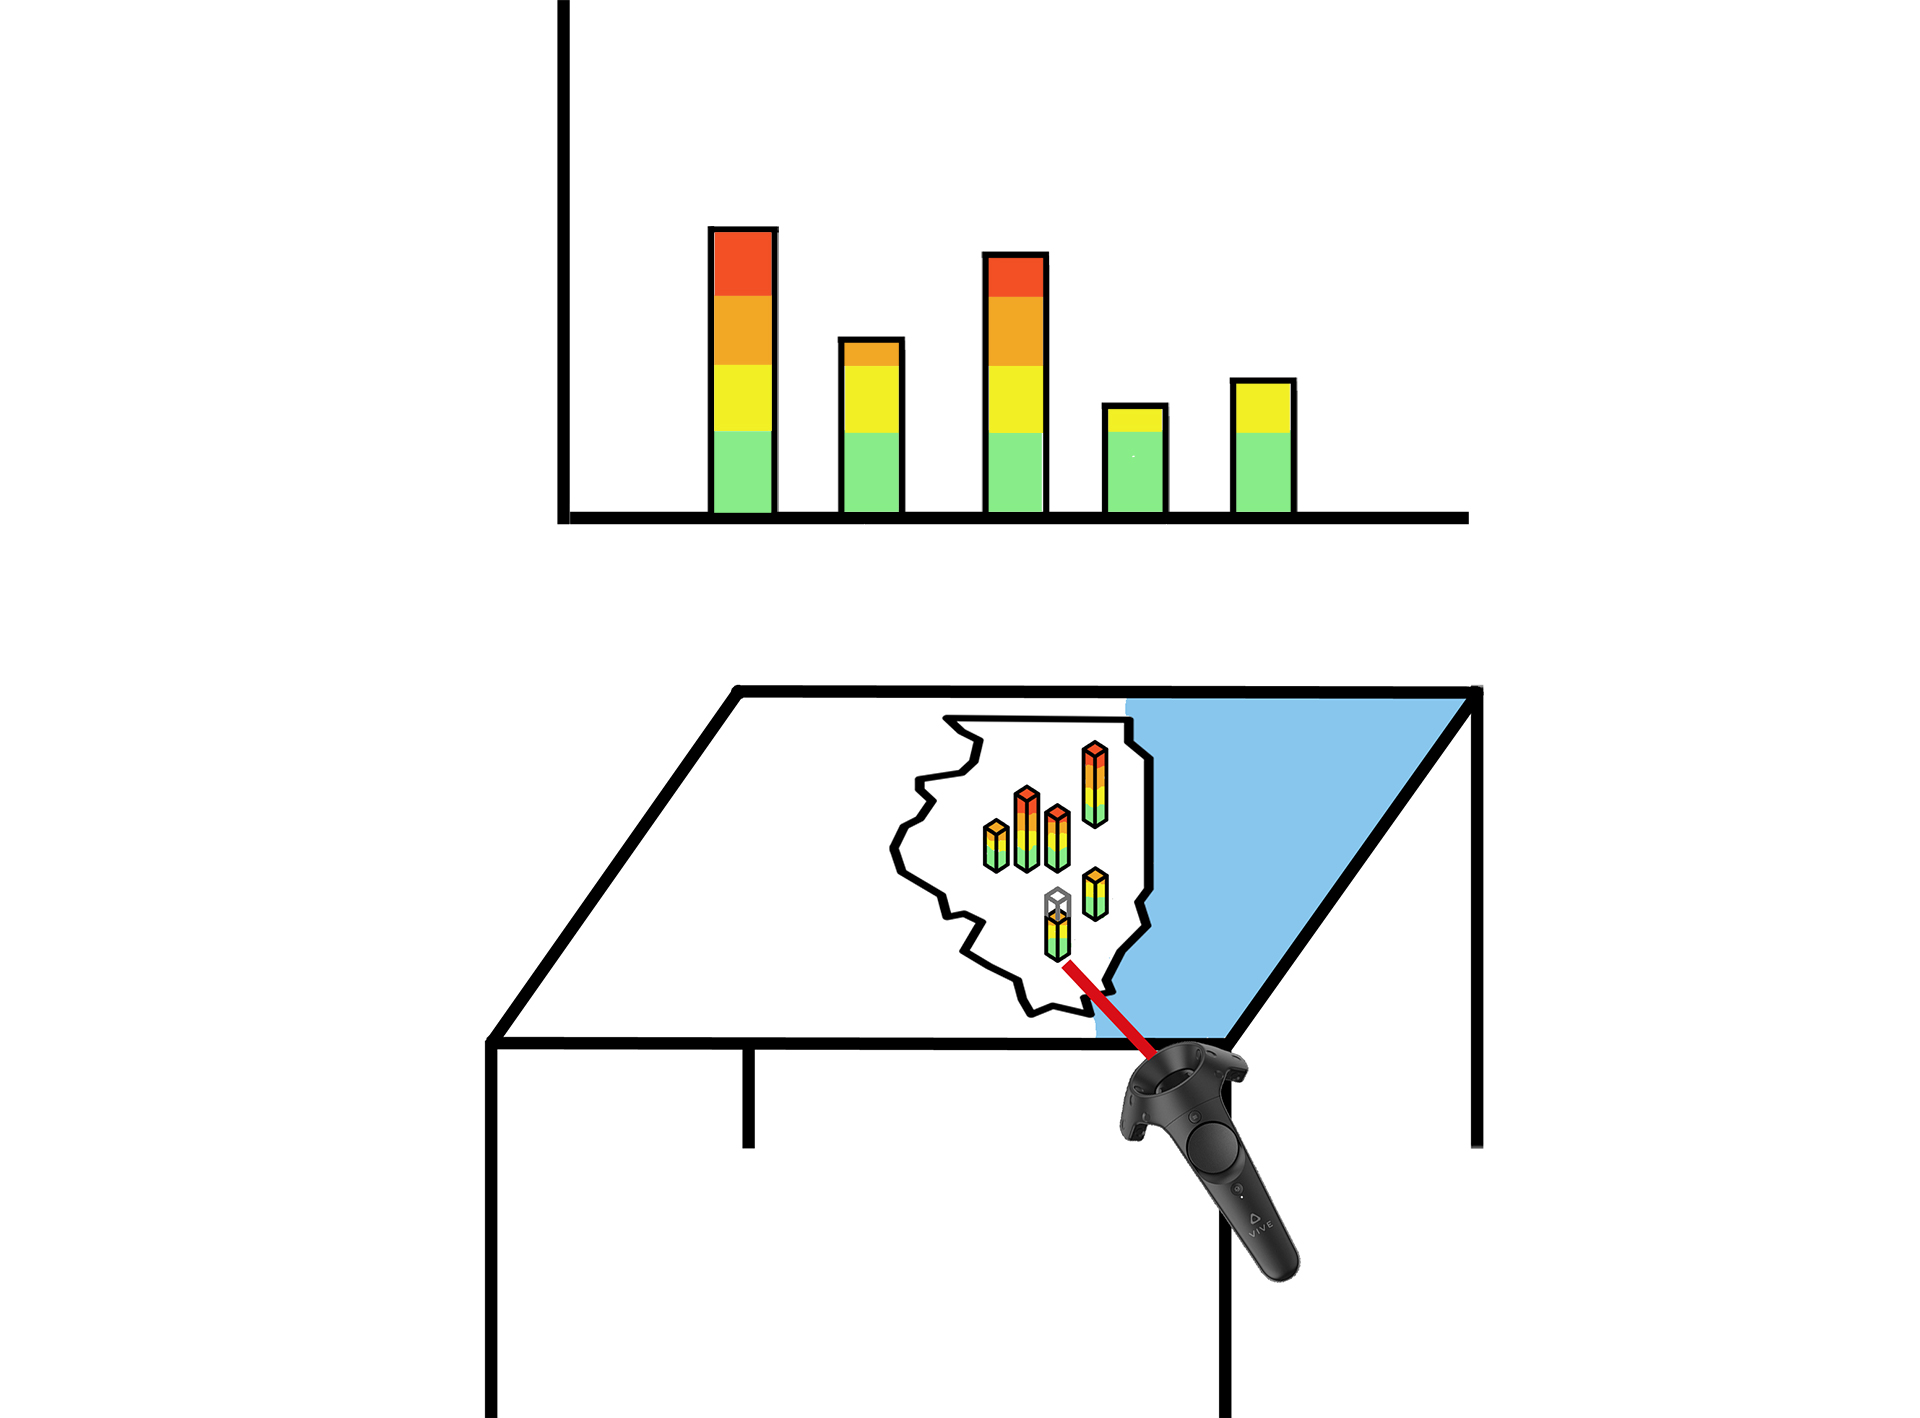
Beats are outlined when the user points the controller on it.
Development
As we were a team of three, we we were able to split the development into small chunks that each of us worked on separately and then – collaboratively – put them together in the end. For example, after one of my teammates succeed in creating 3D polygon meshes from a set of geo-coordinates and the other teammate implemented the basics of the 2D bar chart, I took care of how to select the 3D beats, drag and drop them onto the bar chart and manipulate them. Similarly, while one teammate created the 2D UI, the other teammate and I implemented the functions available in the UI, such as normalizing the data or rendering only selected beats.
One example function: After using normalization, the differences between the beats becomes clearer.
As is most often the case during development, the things that seem the most ordinary were the most complex ones to implement: For example, in the beginning, my teammate was stuck for ages on how to implement the 3D polygon meshes. Later, I strongly underestimated how long it would take me to implement the sorting of bars in the 2D bar chart because Unity handled specific events in a different way than I expected.
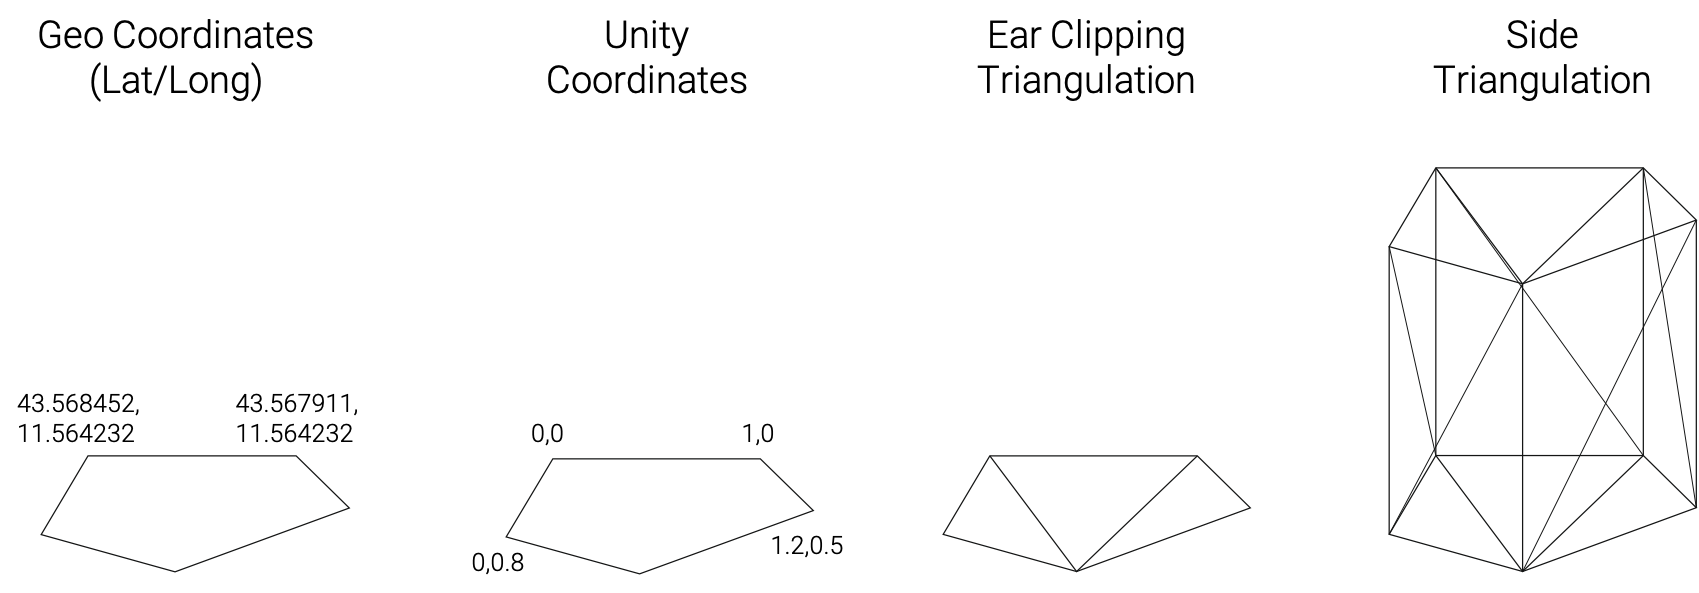
One of the more difficult problems: Building 3D meshes from geo coordinates.
In comparison, adding the features behind the UI went very smoothly, because we took our time to build a clean data structure that allowed easy manipulation of all polygon meshes.
Finish and Presentation
In the end, this was a very fun project for all of us for multiple reasons: For one, we could work with real data, which was a nice change to other student projects (and there are less interesting datasets than crime datasets ;)). Secondly, we were able to present our work not only in the student course but also to the local police, who had a lot of fun testing our tool. More importantly, we – as a team – collaborated greatly and had a lot of fun both thinking about novel features and how to implement them.
Used Tools
Below, you’ll find a non-extensive list of tools I used in this project.
Hardware
HTC VIVE Pro and Controllers
Software
Unity
Languages
C#